EXECUTIVES

Abdullah S. M. Al-Handi
Chairman
Saud S. I. Al-Oraifi
Board Member
Saud S. I. Al-Oraifi
Board Member
Saud S. I. Al-Oraifi
Board Member
Saud S. I. Al-Oraifi
Board Member
Saud S. I. Al-Oraifi
Chairman
Saud S. I. Al-Oraifi
Board Member
Saud S. I. Al-Oraifi
Board Member
Saud S. I. Al-Oraifi
Board Member
 DOWNLOAD PDF
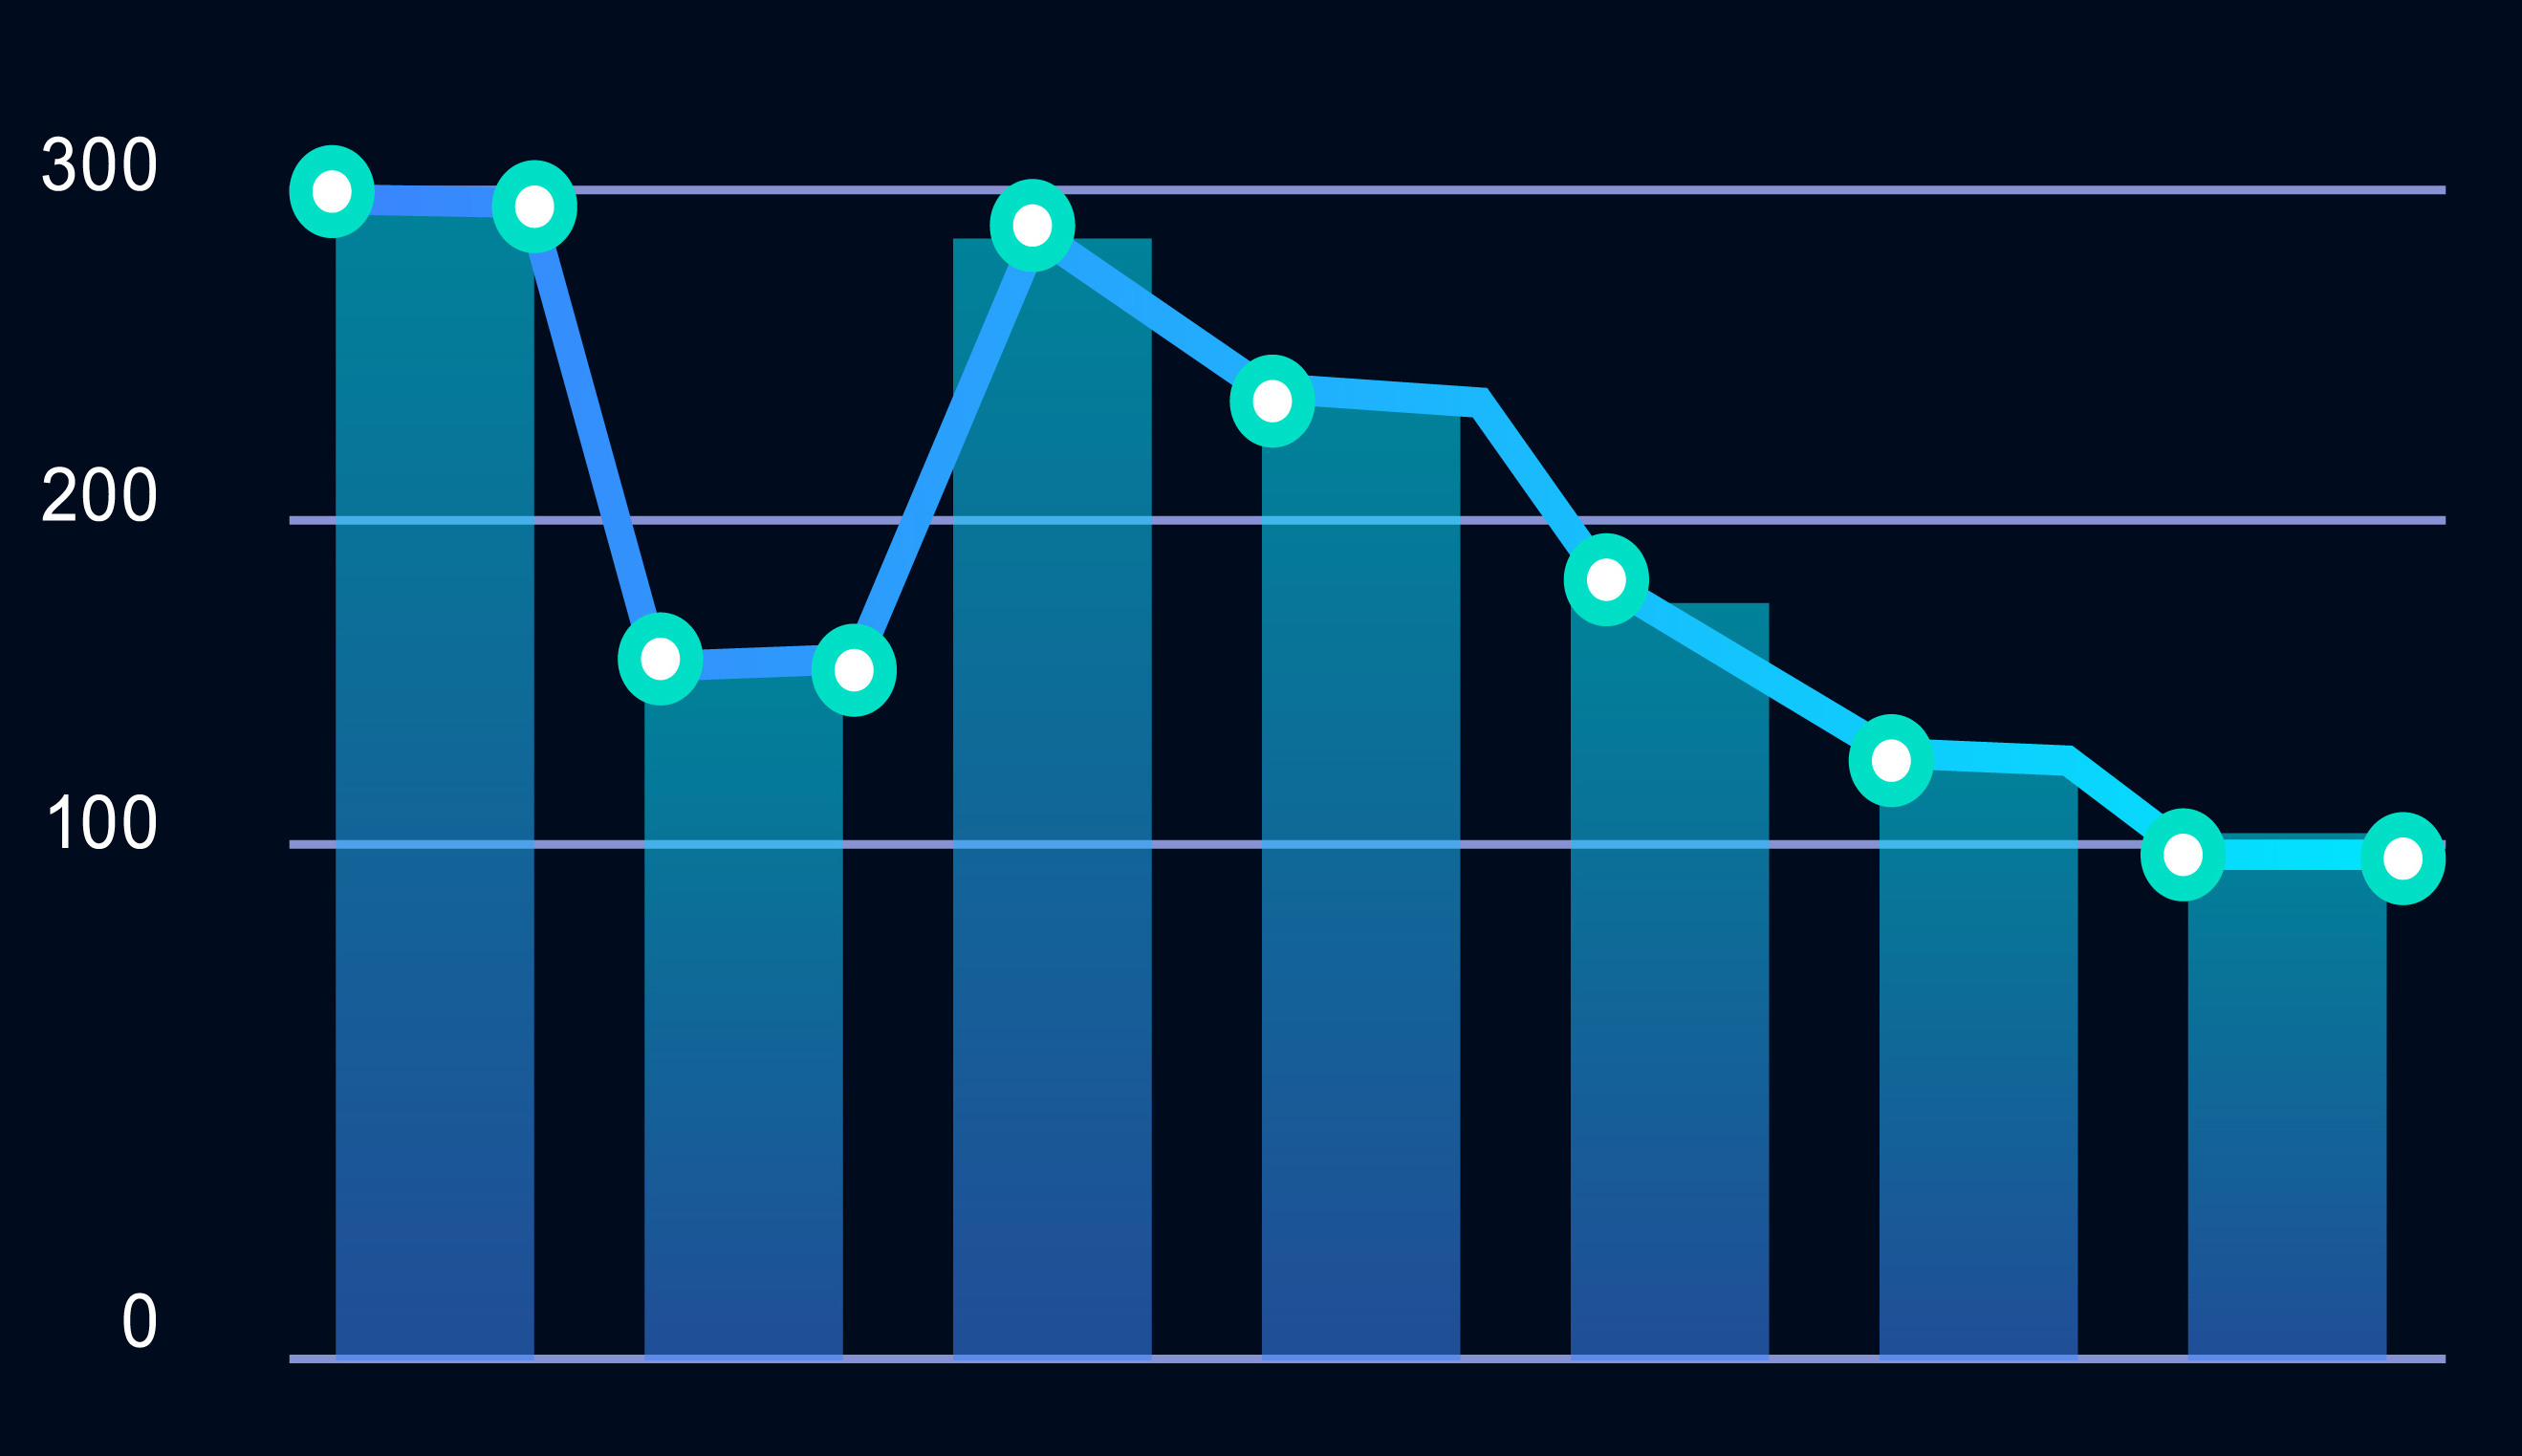
 Gross Premiums
 Yearly Financial Statement 2023


 Investor.Relation@alsagr.com
 www.alsagr.com
 +966 38302294